
in summary
The SHINE experiment is a practical measurement of how long a typical neon indicator tube will last before it becomes too dim to be usable. In the past predicting this behaviour has been speculative or inaccurate. A theoretical basis and a precision measurement tool were developed for this purpose. The experiment focuses on the IN-13 bargraph tube, although the tools and techniques can be used on most glow discharge tubes.
While the experiment is in progress a live webcam feed of the measurement screens is available, as well as a table of the measurements taken since the beginning of the experiment.
motivation
In the last decade neon glow tube technology dating back to the Cold War has become popular amongst electronics enthusiasts. In fact, ‘nixie’ tubes are at the centre of limited-edition niche applications, most notably nixie clocks. The technology has also made several appearances in popular media (little does Mason know that ‘the numbers’ are nixie digits).
These tubes have been out of production for several decades, causing their trade prices to skyrocket. Therefore the lifetime of the tubes is of great and continuing interest to the hobbyist and commercial product designer alike.
The question on the lifetime of nixie tubes is frequently posed, yet due to the complicated nature of the subject a substantiated answer is rarely given. Manufacturers of some type of tubes quote as few as 1000 hours of operation, but users of those tubes will readily disprove that.
At SALTechips many of our customers also ask us how long we expect these tubes to last. To provide them with a reliable answer as well as advance the knowledge amongst the nixie community, we designed the SALTechips IN-13 Endurance experiment (SHINE).
objective
The objective of the SHINE experiment is to quantify the loss of brightness of a standard IN-13 over a prolonged period of time and under normal operating conditions. The loss of brightness (herein attributed to cathodic sputtering) is used as a measure of the lifetime of the tube.
theory
Failure mechanisms for cold-cathode discharge tubes
Mechanical damage
Cold cathode tubes are fragile structures of metal and ceramic components in a glass envelope.
Mechanical damage can occur due to impact or vibration. High levels of vibration can disjoint or bend internal structures. However, as such high vibration levels are in practice created by an impact, the glass envelope is likely to break first. The gas evacuation nipple is particularly susceptible to breakage.
The glass-metal seals formed at the electrical connection pins can crack under excessive stress due to small-radius bending or local heating (e.g. when soldering).
Mechanical damage can also occur if excessive current is allowed to flow through the glow discharge, melting the electrodes or causing the envelope to explode from excessive internal pressure.
The effects of mechanical damage are usually catastrophic, irreversible and abrupt.
Contamination of gas mixture or electrodes
Contamination of the gas mixture or electrode surface alters the electrical characteristics of the tube. Standard tube driving circuits are unable to detect such deviations, therefore if the contamination is severe it can lead to unacceptable display inaccuracy and the tube being discarded.
Outgassing of the glass envelope is a source of contaminants. At temperatures developed in a cold cathode tube, the outgassed mixture of common soda-lime glass is 98% pure water vapour (Todd, 1955).
Outgassing also occurs at the electrodes by absorption (Malev, 1972) and adsorption of gas atoms (Moraw, 1986).
The effects of contamination are gradual and reversible in most cases. For this purpose cathodic sputtering is broadly used at the time of manufacture but also periodically during operation.
Cathode material deposition
During operation of the tube, cathode material is deposited on the glass envelope and internal surfaces. The phenomenon, known as sputtering, is due to the ejection of cathode material in the form of uncharged atoms as a result of bombardment by gas ions from the glow discharge. It is detrimental on the light output of the tube and for indicator tubes it can signal the end of their usable life.
A side-effect of sputtering is the formation of conductive films on insulating surfaces, leading to parasitic current paths that can interfere with normal operation. This was the subject of a different study.
The amount of sputtered material depends on ion density, ion energy, gas pressure, angle of impingement on the cathode and time. In a standard cold cathode tube the ion energy can vary between zero and that of the cathode fall, the ion density is linked to the ion density and ions can impinge on the cathode at random angles. What is more, the gas pressure is sufficiently high for most of the ejected material to be back-diffused to the cathode. As a result rigorous modelling of sputtering in a glow discharge is challenging and experimental results sparse.
Traditionally, theories on sputtering were developed using purpose-built tubes at low gas pressures. The sputtering yield i.e. the mean number of sputtered atoms per incident ion was measured by weighting the cathode electrode, measuring its resistance, or measuring the change in light transmittance of a transparent target. The results were then extrapolated for higher pressures present in glow discharges. Nevertheless cathodic sputtering remained a popular research topic when glow discharge tubes were mainstream and entire chapters were devoted to the subject in literature of the time.
Of most relevance to this experiment is the work by Stocker, measuring the rate of deposition of molybdenum films in inert gases over the pressure range of 3-21 torr. The gases used were pure neon, a Penning mixture of 99% neon/1% argon and finally pure helium (Stocker, 1961).
The sputtering rate was inferred by measuring the change of optical absorbance of the deposited material versus time. Optical absorbance A, or optical density, is defined as the natural logarithmic ratio of the light intensity transmitted through the material Ir and the intensity falling upon a material Io. It is expressed as:
A = -ln(\frac{Ir}{Io}) [1]
It was found that the optical absorbance increases linearly with time as material is deposited, meaning that transmitted light intensity falls exponentially. Additionally, the deposition rate increased with higher current and decreased as gas pressure was increased (see fig.1). The results were the same for pure neon and the Penning mixture.
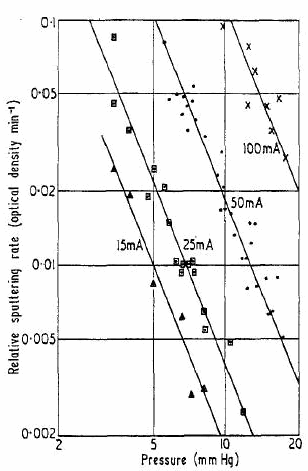
Stocker related the gas pressure p and current i to the sputtering rate M by the following empirical expression:
M = C(\frac{i}{p})^{2.5} [2]
where C is a scaling constant, identical for the pure neon and Penning mixture cases.
The optical absorbance can also be expressed in terms of the absorption coefficient α of the material, and its thickness τ as follows:
A = \alpha\tau [3]
The mean material thickness as a function of time t can be expressed as follows:
\tau = Mt [4]
Substituting equation 4 into 3 the absorbance is written as:
A= \alpha Mt [5]
Combining equations 1 and 5 we have:
-ln(\frac{Ir}{Io})=aMt [6]
The SHINE experiment is exclusively concerned with the intensity of the received radiation, the deposition rate and absorption coefficients being unknown. Therefore solving for Ir equation 6 becomes:
I_r = I_o e^{-aMt} [7]
During manufacturing of the tube some material is deposited on the walls. Therefore the true light intensity of the glow discharge cannot be readily measured. However, since we are only concerned about the relative change of light intensity we can allow for the received intensity from a new tube to be equal to the glow discharge intensity.
Therefore for a new tube at the beginning of the experiment at time to:
I_r(t_o) = I_o [8]
Substituting equation 8 into 7, the light intensity emitted by a cold-cathode glow discharge tube as received by an external photo sensor as a function of time is:
I_r(t) = I_r(t_o)e^{-aMt} [9]
where (reiterating the symbols for convenience) I_r(t) is the light intensity at arbitrary time t, I_r(t) I_r(t_o) is the light intensity at the beginning of the experiment and using a new tube, a is the absorption coefficient of the sputtered material and M is the material deposition rate at a given current and gas pressure. The product αM is treated as a constant and the experimental apparatus must be designed for this (e.g. constant current tube driver).
It must be noted that I_r(t) and I_r(t) I_r(t_o) have the same units, enabling equation 9 to be used with different experimental apparatus. For example, if the photo sensor measures the total luminous flux from a nixie tube, the unit for both symbols would be lumens. If the sensor measures luminous intensity the unit for both symbols would be candelas. In both cases equation 9 remains valid.
The practical implication of equation 9 is that the tube will become dimmer with time, doing so increasingly slower. In order to determine the end of usable life of the tube, a threshold must be set. Below the threshold the tube will not be bright enough for its intended application. We quasi-arbitarily selected a cutoff threshold of 30%, considering that glow discharge tubes are nowadays primarily used in dark environments and the sensitivity of the human eye is quasi-logarithmic, meaning that lower light levels can easily be detected. Therefore, at some time t the cutoff threshold is reached:
I_r(t) = 0.3 I_r(t_o) \Rightarrow e^{-aMt} = 0.3 [10]
The equation has multiple unknowns as, as explained earlier, the absorption coefficient α and the deposition rate M of the sputtered material cannot be readily measured or accurately approximated. Instead, the time t and ratio of intensities will be used to calculate the product αM for the IN-13 tube. The procedure is identical for other glow discharge tubes such as the IN-9, IN-18, B7971, IN-8 etc. as well as hand-made tubes.
Equipment
A diagram of the experimental apparatus is shown in figure 2. The HV power supply is a standard regulated switch-mode power supply of 140V output. It provides power to the tube via a constant current sink of similar design to the subcircuit used in the thermNeon.
Current through the tube is set so that approximately 50% of the tube’s length is illuminated. That way a sufficient illumination length is available for measurement, yet small drift of the driving current will not cause the tube to enter the abnormal glow operating region.
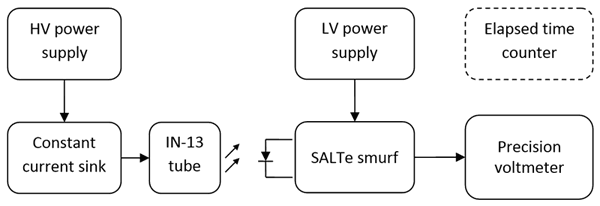
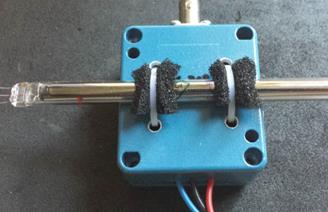
The intensity of the light emitted by the tube is measured by the SALTe smurf. The SALTe smurf is a precision, ultralinear, low noise photometer designed specifically for this application. The current design has a dynamic range of 112dB and a total output noise of 24μV RMS. The output of the SALTe smurf is a voltage signal directly proportional to the light intensity of the tube. The photo sensor and tube are optically coupled by mounting of the tube immediately on the sensor as it can be seen in figure 3. The front of the tube is oriented towards the sensor and locked in place using foam.
The output of the SALTe smurf is measured with an HP-34401A multimeter connected via a short length of coaxial cable (RG-58U). The multimeter is configured as follows:
- DC Volts, autoranging
- 6.5 digit resolution, ‘slow’ integration time (2s @50Hz)
- Input impedance 10 MOhm
As the output signal from the SALTe smurf is linearly proportional to the light intensity of the tube, a 70% light intensity drop will be marked by a 70% decrease of output voltage.
The elapsed duration of the experiment is measured by a crystal-based counter. The counter displays the elapsed time in minutes and an on-screen indicator marks the passing of each second. The counter can count up to 99,999,999 minutes, equivalent to ~190 years, after which it resets and continues counting.
Methodology
| Step | Action | Status |
|---|---|---|
| 1 | Power up all equipment but tube | done |
| 2 | Allow warm up time (~6h) | done |
| 3 | Record ambient temperature | done |
| 4 | Record output voltage offset (tube OFF) | done |
| 5 | Power up tube and adjust illumination length to 50% | done |
| 6 | Allow settling time (~30mins) | done |
| 7 | Record ambient temperature | done |
| 8 | Record maximum output voltage (tube ON) | done |
| 9 | Reset elapsed time counter | done |
| 10 | Enable live feed | done |
| 11 | Record output voltage every week | in progress |
| 12 | Repeat step 11 until end condition is reached | in progress |
| 13 | Publish end of life duration figure for the IN-13 tube | |
| 14 | Plot data points and calculate the product of aM for the IN-13 tube | |
| 15 | Plot light output (equation 9) for the IN-13 tube |
Table 1: List of experimental steps of the SHINE experiment
Protocols for special events
Due to the potentially long duration of the experiment the following procedures are planned in the case of special events that interrupt the normal flow of the experiment.
- Power cut
- Loss of live stream
- Timer overflow
- Damaged tube under test
- Instrumentation malfunction
- Absence at time of measurement
- Move of apparatus
Assumptions
- The failure mechanism that will occur first is loss of brightness due to metal deposition on the glass envelope.
- The measurement equipment experiences long-term drift that is insignificant compared to measured loss of brightness.
- The measurement equipment is sufficiently linear within the operating region covered by this experiment.
- Noise sources (e.g. radiated interferences) or other sources of radiation (e.g. ionising radiation) reaching the detector are insignificant compared to the desired signal or sufficiently suppressed by the data point averaging scheme and the long duration of the experiment.
Results
The experiment is in progress
Watch the live feed above or click here
See the data collected here
Conclusions
The experiment is in progress
References
Malev, M. D. (1972). Gas absorption and outgassing of metals. Vacuum , 43-60.
Moraw, M. (1986). Analysis of outgassing characteristics of metals. Vacuum , 523-525.
Stocker, B. J. (1961). Cathode sputtering in inert-gas glow discharges. British journal of Applied Physics , 465.
Todd, J. B. (1955). Outgassing of Glass. Journal of Applied Physics .


